
Grafana is a popular open-source data visualization tool that supports various object storage and cloud services.
To improve on what they offer, Grafana has announced a new open-source database for continuous profiling data that helps enhance the monitoring of servers (or your application), making life easier for performance engineers and enterprises.
Open Source Database for Continuous Profiling
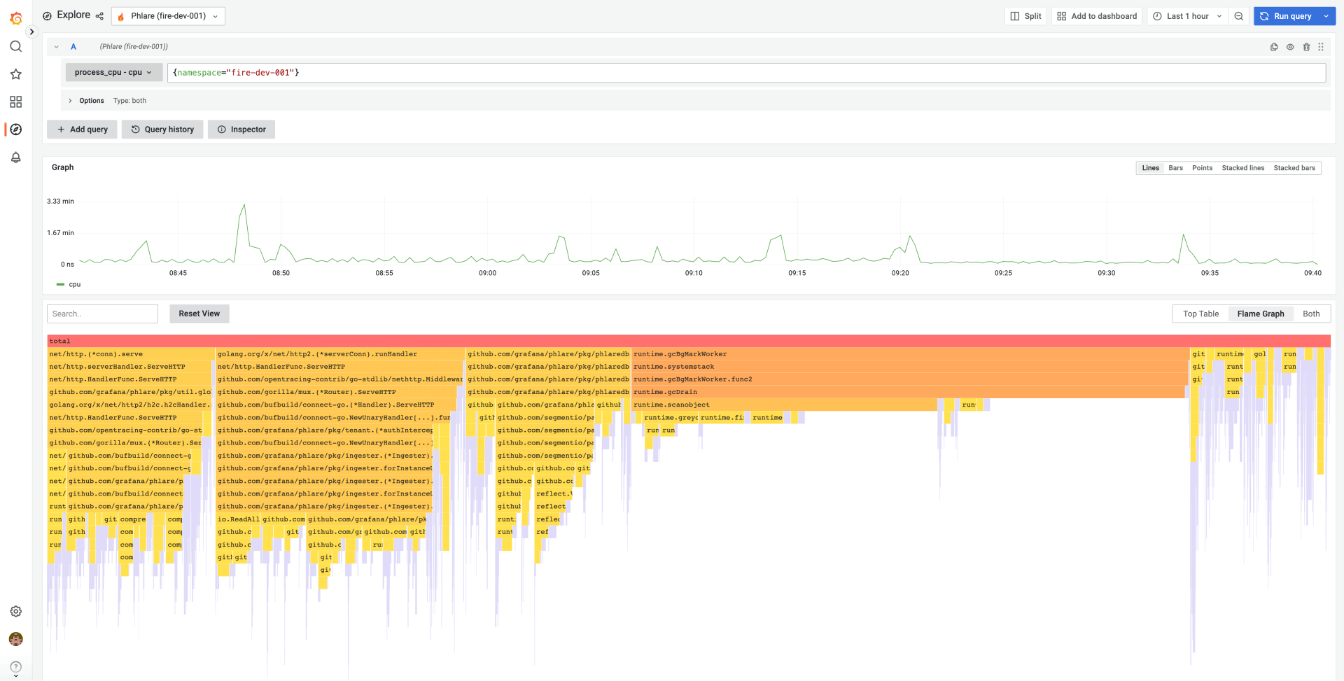
Grafana Phlare is a highly scalable database that aims to provide users with a long-term storage solution for continuous profiling data.
The core features involve:
- Easy to install
- Horizontal scalability
- High availability
- Cheap, durable profile storage
- Natively multi-tenant (enabling independent teams to share the same database)
You would say that: there are already a few similar open-source projects. And you wouldn't be wrong.
But, the team behind Phlare mentioned that those tools were not reliable or scalable enough to meet Grafana Labs' continuous profiling needs.
So we decided to get to work creating a database for continuous profiling telemetry, based on the design principles that have made our other open source observability backends, Loki, Tempo, and Mimir, so successful: horizontally scalable architecture and use of object storage.
- Cyril Tovena, Software Engineer at Grafana
As for the technical tidbits of Phlare, it uses object storage to store profiling data and supports various object storage services such as Amazon S3, Google Cloud Storage, OpenStack Swift, and more.
Also, Cyril mentions that Grafana Phlare is incredibly easy to install:
It’s easy to install with just one binary and no additional dependencies, just like Prometheus.
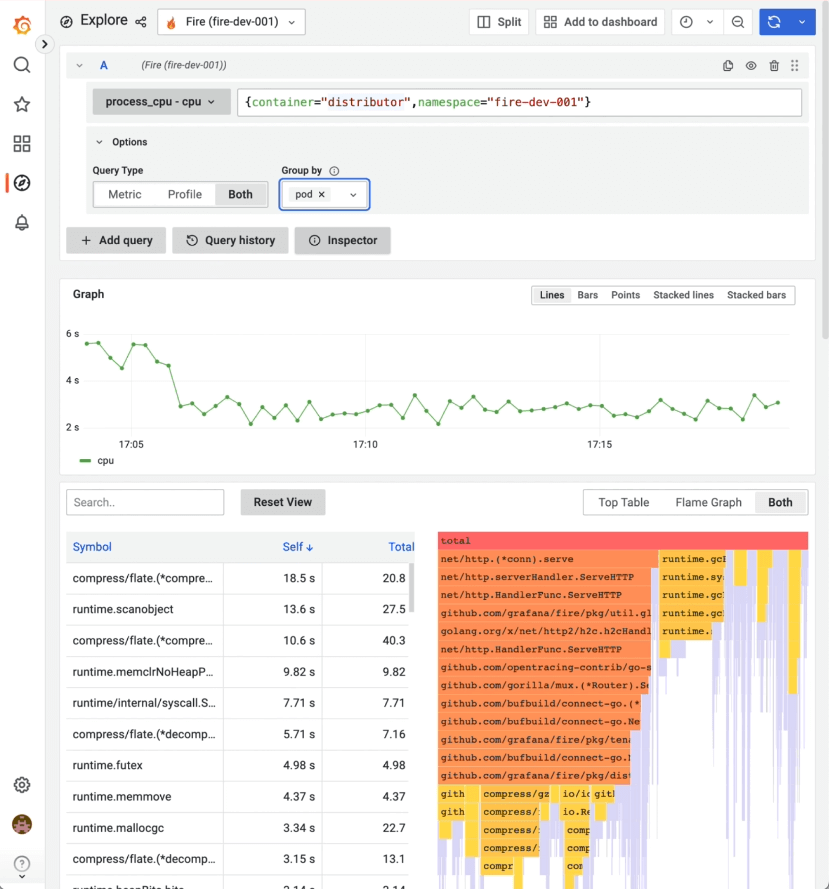
Furthermore, it can natively integrate with Grafana to show users a detailed view of the whole stack and includes various observability signals such as metrics, logs, and traces.
To complement Phlare, the team also added a new Flame graph panel to better visualize system resources data via various data sources.
As a bonus, Grafana also announced a data source plugin for another open-source continuous profiler called 'Parca'.
👨💻 Try Grafana Phlare
Grafana Phlare is made available as a single binary and can be procured from the official GitHub repository.
You may want to review its official documentation to learn more about it.
More from It's FOSS...
- Support us by opting for It's FOSS Plus membership.
- Join our community forum.
- 📩 Stay updated with the latest on Linux and Open Source. Get our weekly Newsletter.


