

I don't think of myself as a sysadmin. I am more of a self-hoster who has some experience hosting websites for me and my friends. That doesn't qualify me as a sysadmin, I think.
And yet, here I am suggesting a tool whose full potential can only be utilized by a seasoned sysadmin (or so I believe).
The tool I am talking about is Netdata. It is an open source network infrastructure monitoring tool. You can self-host it, use it on-prem or opt for their managed cloud service (data stays on your server but is displayed on the hosted dashboard).
 netdata
Netdata lets you collect all kinds of performance metrics and displays them beautifully in a dashboard. Yeah, dashboards! Who doesn't love them?
But I am not discussing the dashboard here.
The feature I love the most: Alert configuration
Here's the thing about dashboards. They are good to look at but you are likely not going to look at them all the time.
The feature I like the most is the alert configuration.
CPU utilization going high? Alert me. Disk is about to run out of space? Notify me?
A timely alert can save the server from going down and thus avoid service disruption.
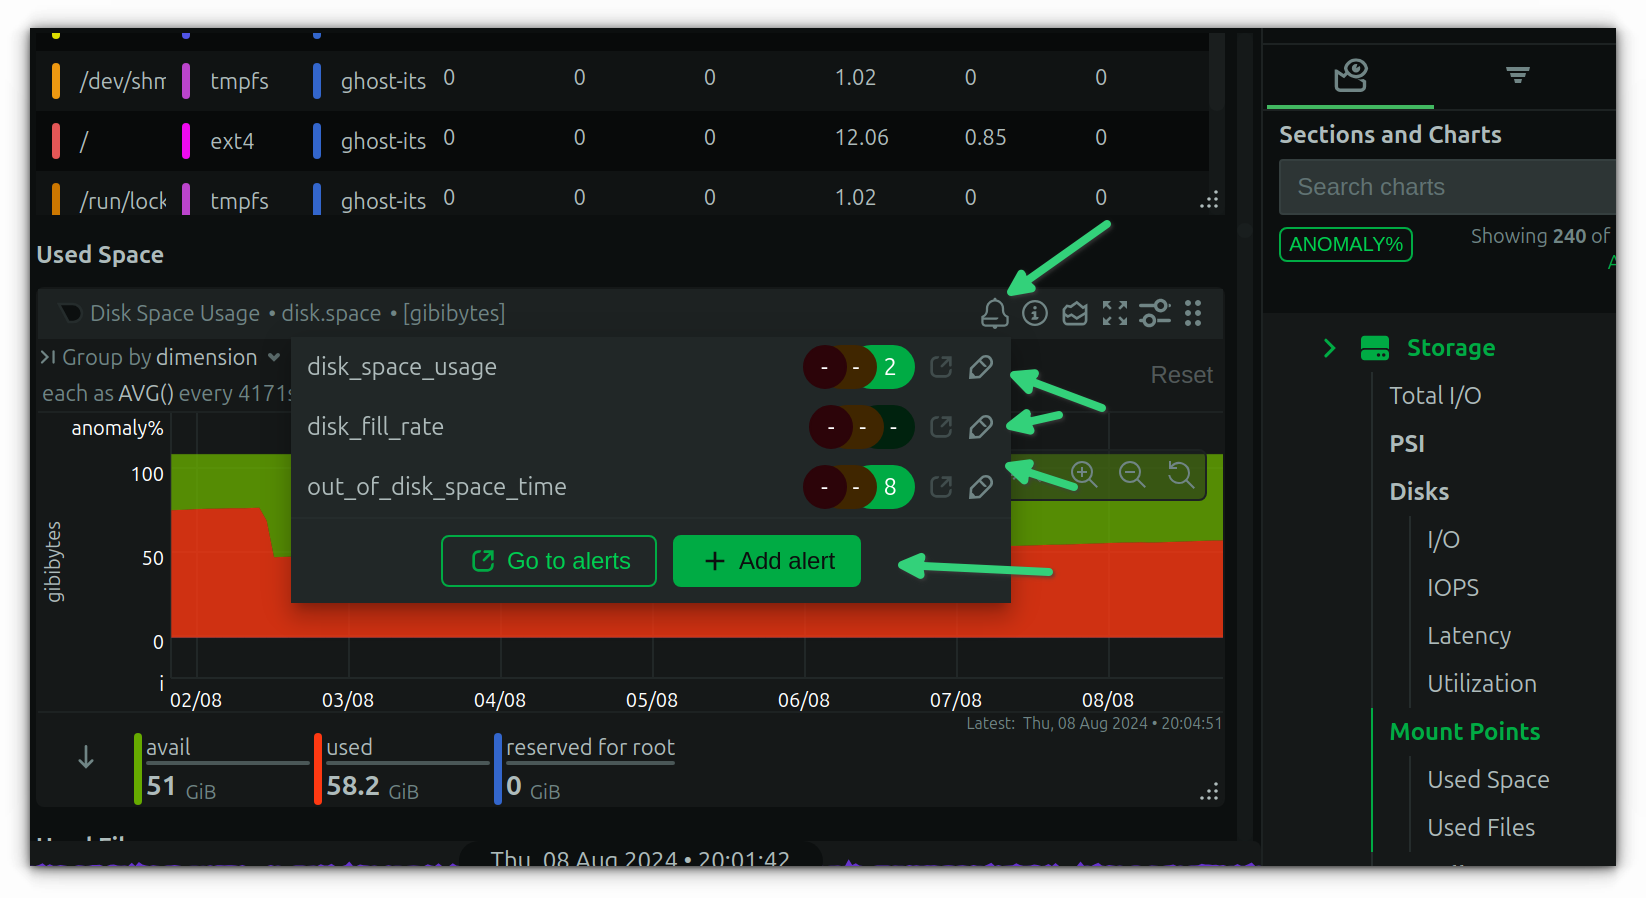
While Netdata comes with default alert configuration for several performance metrics, it is easy to change as per your preference.
For example, the default disk space utilization is set at 80% for warning and 90% for critical. But I prefer keeping the alert at 75%.
Configuring alerts is really simple. You can either to go the dedicated alert tab or just change them from the dashboard itself.
The same goes for memory and CPU utilization and tons of other performance metrics that Netdata tracks.
More details on the alert configuration can be found here:

Now, this could be a tiny feature but I like it and it has saved my servers, hosting Ghost CMS, a few times. Perhaps it will benefit you as well.
- Even the biggest players in the Linux world don't care about desktop Linux users. We do.
- We don't put informational content behind paywall. Your support keeps it open for everyone. Think of it like 'pay it forward'.
- Don't like ads? With the Plus membership, you get an ad-free reading experience.
- When millions of AI-generated content is being published daily, you read and learn from real human Linux users.
- It costs just $2 a month, less than the cost of your favorite burger.
Become a Plus Member today and join over 300 people in supporting our work.


